Capturing browser logs
Collecting Browser Console Logs
Before obtaining browsers logs (or console logs) from Chrome or Firefox, enable timestamps on your browser. This helps synchronize client and server timings.
Enabling timestamps and preserving logs upon navigation
Using Chrome
From the menu bar click View > Developer > Developer Tools.
Click the Customize and control Dev Tools button (3 vertical dots)
Click Settings
Under Preferences tick the following check boxes:
Log XML HTTPRequests
Show timestamps
Preserve log upon navigation
Using Firefox
From the menu bar click Tools > Web Developer > Toggle Tools
Click Customize Developer Tools and Get Help
Click Settings (The cog button)
Tick the following checkboxes:
Enable timestamps
Collect console logs on Chrome or Firefox
Open the Developer Tools
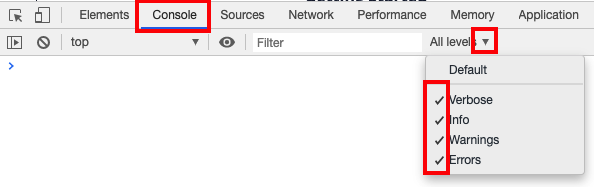
In chrome ensure you are collecting verbose level logs like this
Perform the steps of the scenario to capture.
Depending on your browser:
Right click > Save as (notepad text file).
Right Click > Select All, Right click > Copy.
Paste that into a text file.
Attach the text files to your support ticket.
Using Internet Explorer:
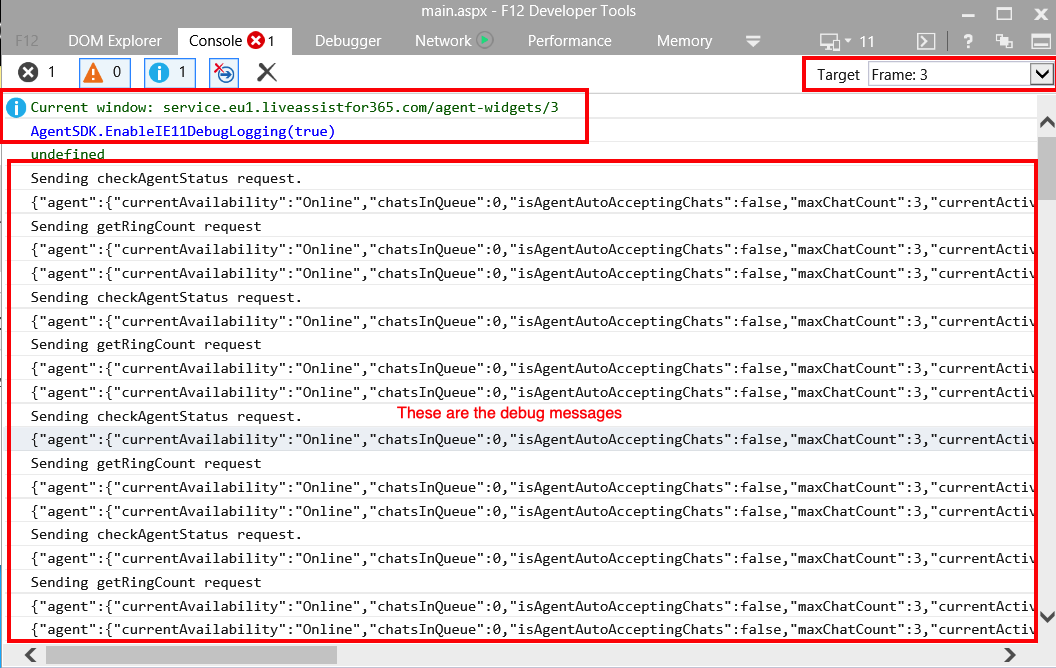
Press the F12 key to open the Developer Tools Window
In the Console Tab, enable extra logging by selecting target Frame: 3 and executing the following command:
AgentSDK.EnableIE11DebugLogging(true)Perform the steps of the scenario to capture.
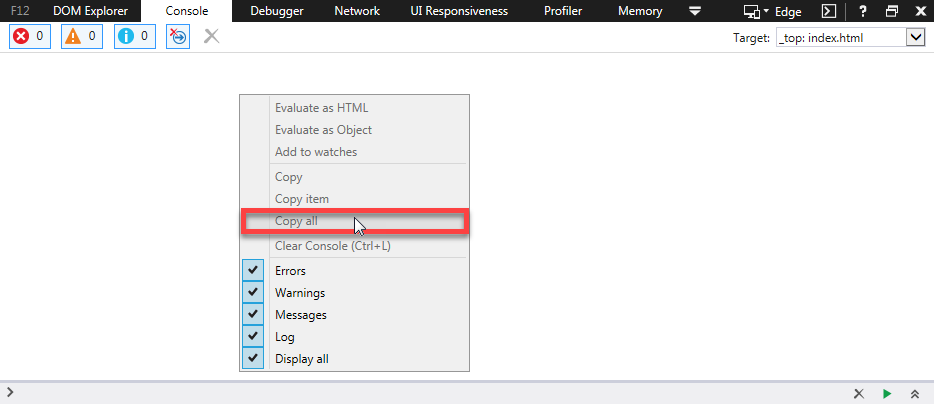
From the Console Tab, Right click and click Copy All
You disable the extra logging by executing:
AgentSDK.EnableIE11DebugLogging(false)Note: It recommended to turn debug logging off after testing as leaving it on for extended periods can cause IE to crash.
Collecting HAR logs
The HAR logs contain a lot more detail from the Internet Explorer browser.
The HTTP Archive format or HAR, is a JSON-format archive for logging of a web browser's interaction with a site.
How to generate a HAR on Chrome
Open Google Chrome and go to the page where the issue is occurring.
From the Chrome menu bar click View > Developer > Developer Tools .
The panel opens at the bottom of your screen, select the Network tab.
Look for a round Record button ( ) in the upper left corner of the Network tab; it is red when recording. If it is grey, click it once to start recording.
Check the box next to Preserve log.
Click the Clear button ( ) to clear out any existing logs from the Network tab.
Perform the steps of the scenario to capture. This might involve refreshing the page first.
Right click anywhere on the grid of network requests, select Save as HAR with Content, and save the file to your computer.

How to generate a HAR on Microsoft Edge (or Microsoft Internet Explorer)
Browse to the URL where you wish to begin capturing
Navigate to Developer Tools (use F12 as a shortcut) and select the Network tab.
Perform the steps of the scenario to capture.
Click on Export as HAR
Click Save As... to save the HAR file (or XML if using older version of IE).
Collecting Other Non-Browser Logs
Collecting USD Logs or Network Traffic
Please refer to: Capturing USD logs. This section also includes steps for capturing network traffic.
Collecting logs from Chrome on Android
Typically, applications manage their own logs running on Android. To access Android logs root access you require root access. It is possible to collect logs with a remote debug session. See: Remote Debugging Android Devices.
Collecting logs from Safari on iOS
Collect run time logs with Safari Web Inspector.
See: