Global insights
You can access Global Insights through the catalog actions.
Global insights include two dedicated dashboard views:
- Courses: Displays all average course insights
- Learning paths: Displays all average learning path insights
You can access the space insights from the space catalog. When global insights are viewed within a space context, only content created within that space will be displayed.
Smart Courses offers infinite scrolling to easily go through insights, the app loads more data as the user scrolls down.
Courses
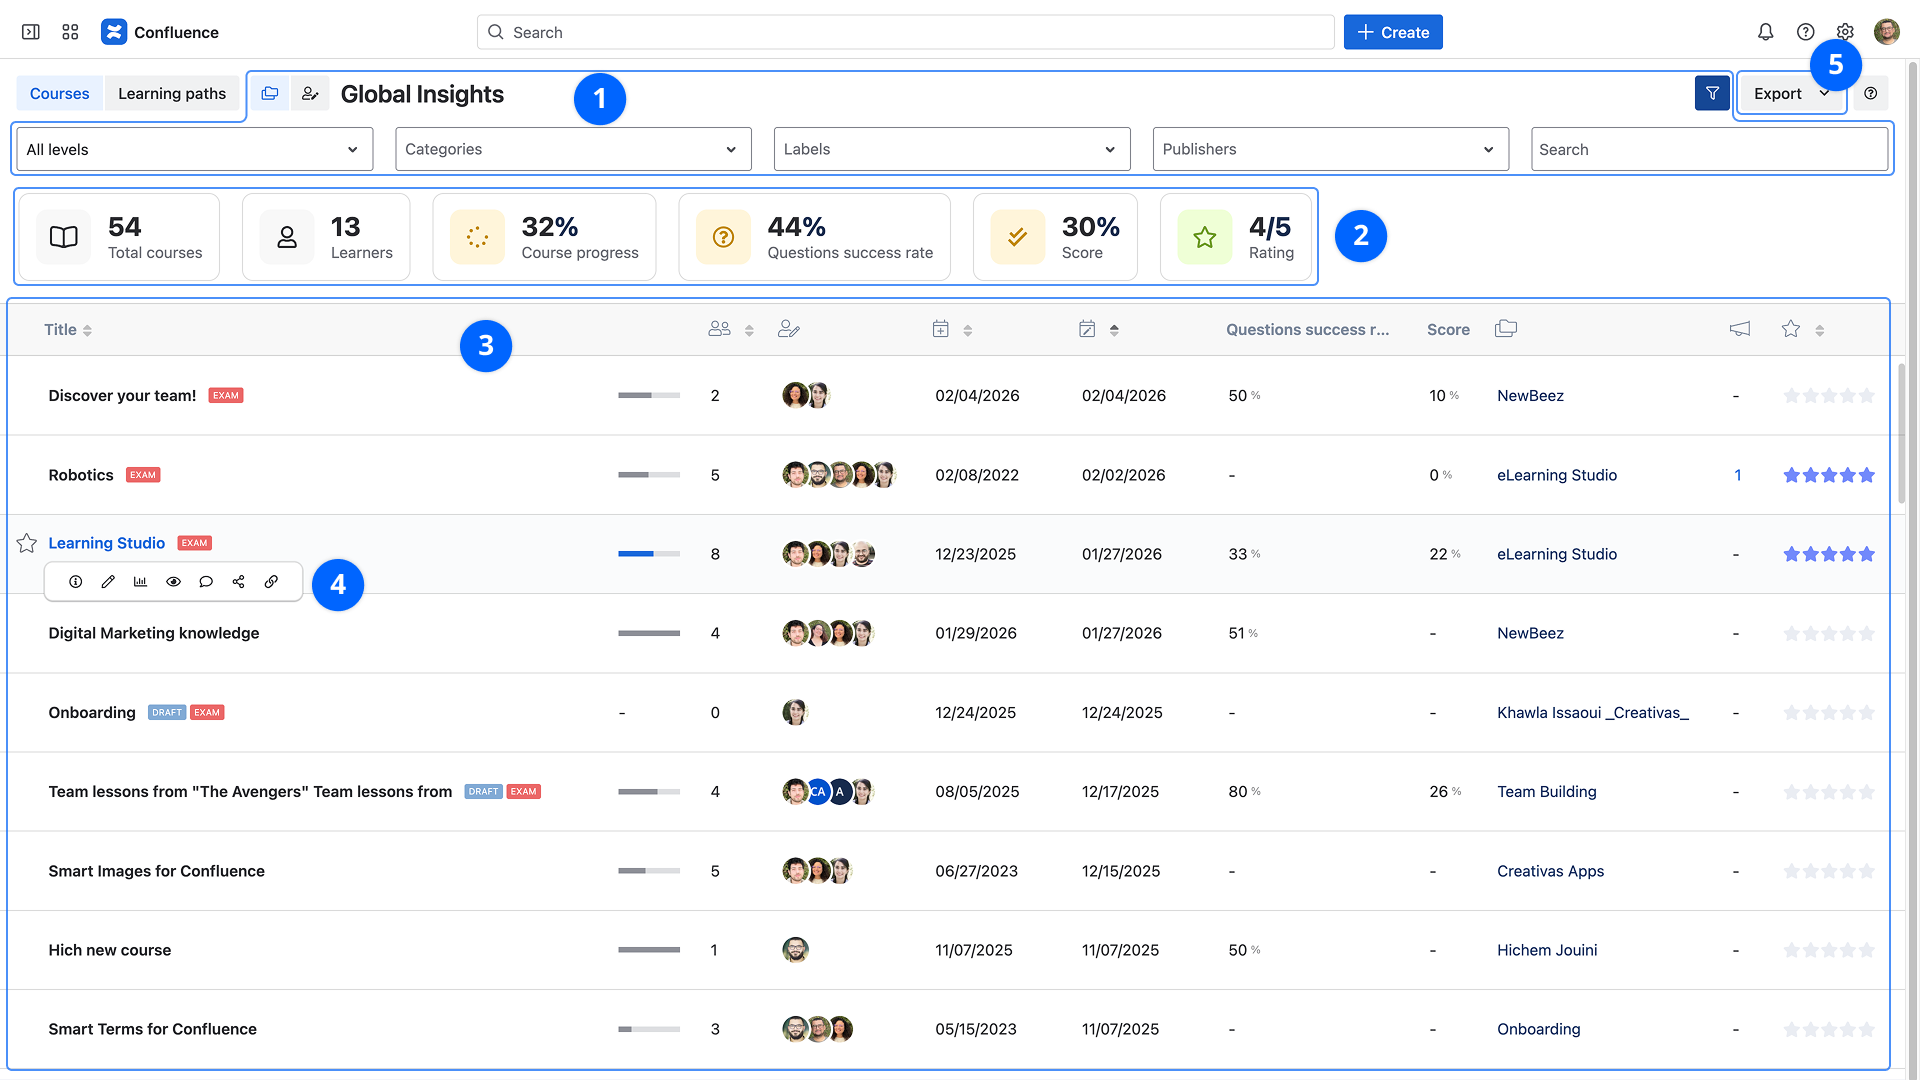
1. Filtering
All insights / My insights
- All insights: courses accessible to the user
- My insights: the courses in which the user is a creator or a contributor.
Advanced filtering
- Difficulty levels: Choose difficulty level from drop-down menu
- Categories: Filter using categories
- Labels: Filter using labels
- Contributors: Search by contributors' names
- Search a course: The search indexes the course title and the content of About this course
2. Average indicators
- Total courses: Listed courses count
- Learners: Learners count
- Course progress: The average percentage of visited components for all courses
- Questions success rate: The average right answers rate for the answered questions
- Average score: The average score of all learners
- Rating: the overall average rating
Average score is only displayed when there is at least one Exam mode course in the list.
3. Insights grid
This grid lists the average course insights. Each row corresponds to a course:
- Title: Course title with a link to the detailed insights of this course. A special indication is displayed next to the title if the course is an Exam, a SCORM, or a Draft
- Course progress: The average percentage of visited components
- Learners: Learners count
- Publishers: List of users who have contributed to the course
- Publication date: Last publication date
- Modification date: Last modification date
- Questions success rate: the average right answers rate for the answered questions
- Score: The average score of all learners
- Space name: The space name where the course is created
- Feedback [Cloud]: the number of feedback submitted for the course
- Rating: the average rating
Average score is only available if the course is an exam.
CLOUD ONLY: Course editors can click on the number of feedback to browse the list of submitted feedback.
4. Actions
- Course details: Displays additional content information
- Edit: Open course editor
- Course insights: Open course insights
- Preview: Open course preview
- Comments: Browser or add course comments
- Share: Select a user or a group of users to invite them to attend the course
- Copy course link: Copy course player link
Click on the course title to open its insights.
5. Export insights
Select the XLSX or CSV format to export all the data from the grid.
Learning Paths
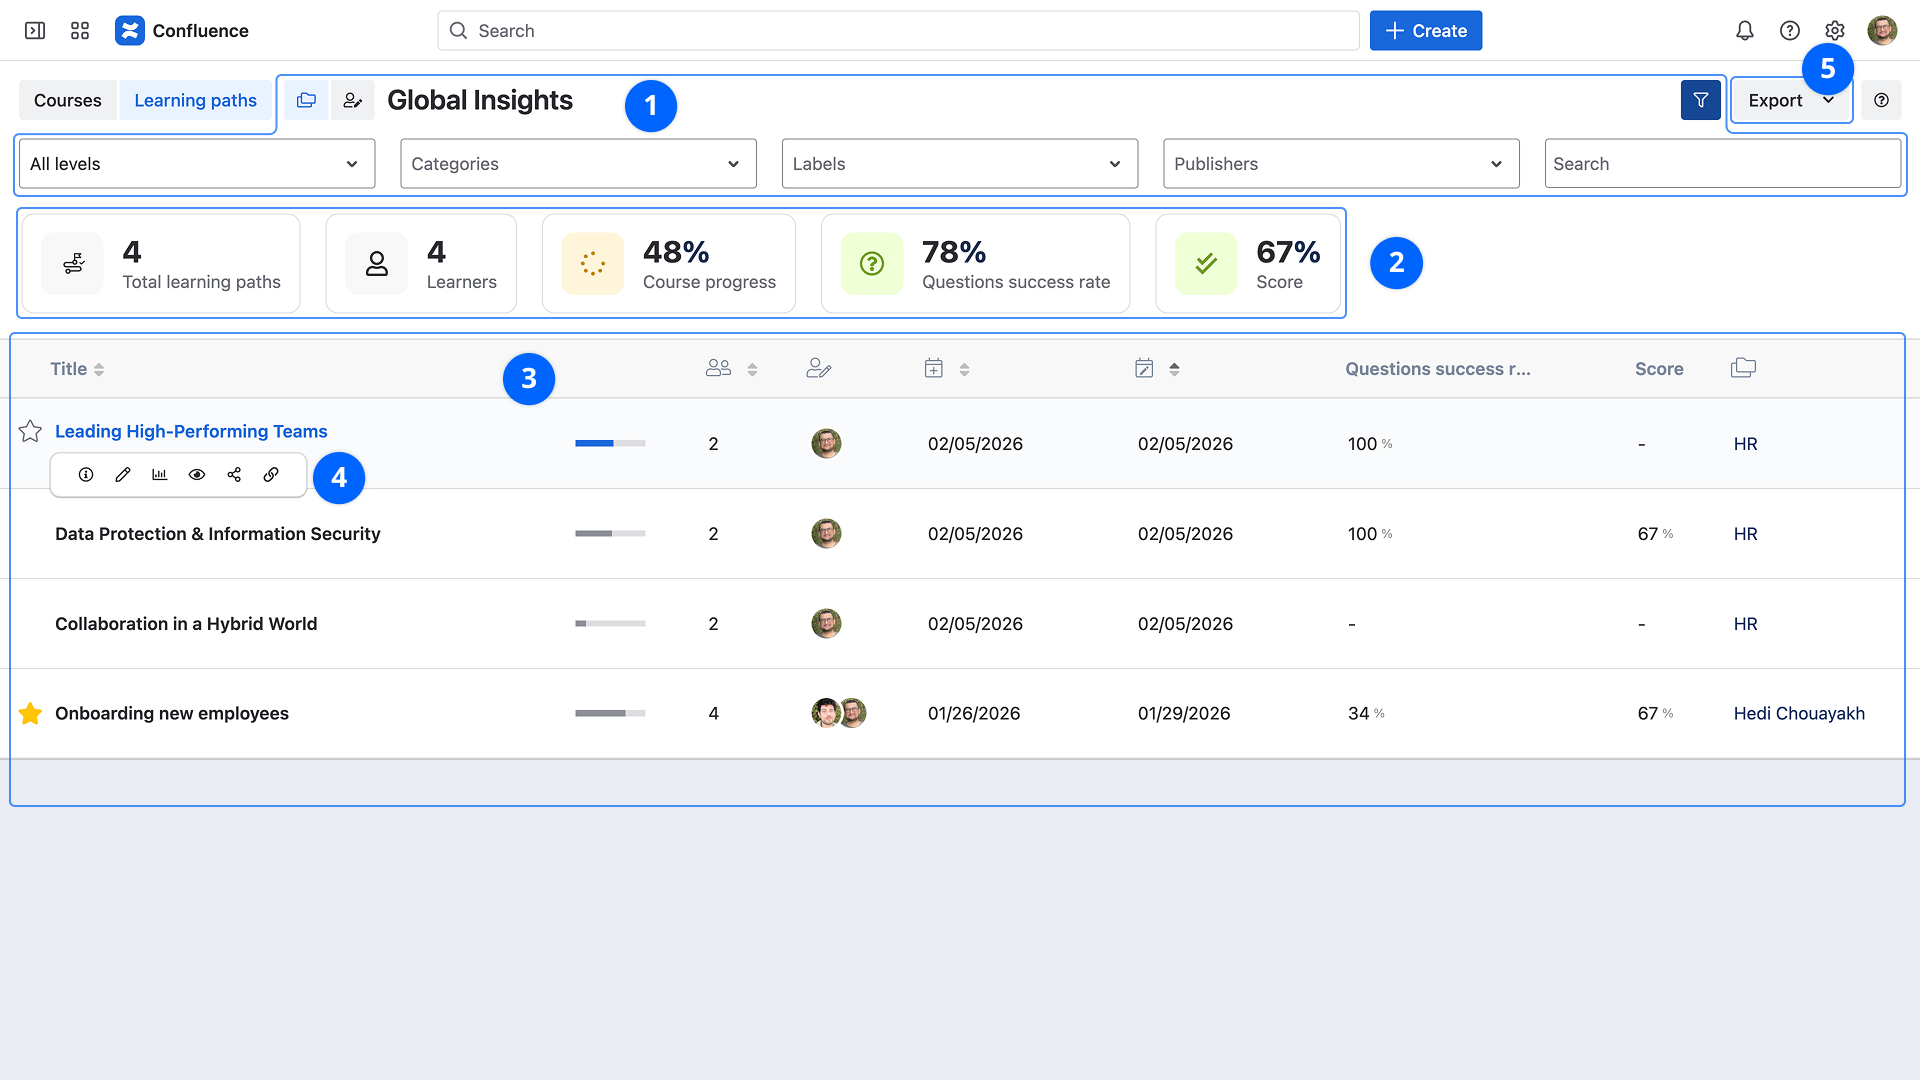
1. Filtering
All insights / My insights
- All insights: learning paths accessible to the user
- My insights: the learning paths in which the user is a creator or a contributor.
Advanced filtering
- Difficulty levels: Choose difficulty level from drop-down menu
- Categories: Filter using categories
- Labels: Filter using labels
- Contributors: Search by contributors' names
- Search a course: The search indexes the learning path title and the content of About this learning path
2. Average indicators
- Total learning paths: Listed learning paths count
- Learners: Learners count
- Course progress: The average percentage of visited components for all learning paths
- Questions success rate: The average right answers rate for the answered questions
- Average score: The average score of all learners
3. Insights grid
This grid lists the average course insights. Each row corresponds to a course:
- Title: Course title with a link to the detailed insights of this course. A special indication is displayed next to the title if the course is an Exam, a SCORM, or a Draft
- Course progress: The average percentage of visited components
- Learners: Learners count
- Publishers: List of users who have contributed to the course
- Publication date: Last publication date
- Modification date: Last modification date
- Questions success rate: the average right answers rate for the answered questions
- Score: The average score of all learners
- Space name: The space name where the course is created
4. Actions
- Learning path details: Displays additional content information
- Edit: Open learning path editor
- Course insights: Open learning path insights
- Preview: Open learning path preview
- Share: Select a user or a group of users to invite them to attend the learning path
- Copy course link: Copy learning path player link
Click on the learning path title to open its insights.
5. Export insights
Select the XLSX or CSV format to export all the data from the grid.