Learning Path insights [Cloud]
You can access Learning path insights through card actions.
Learning Path insights include two dedicated dashboard views:
- Courses: Displays the learning path's courses and exams insights
- Learners: Displays the learners progress within the learning path
The latest learning path version and when it was last saved are displayed next to the title.
Smart Courses offers infinite scrolling to easily go through insights, the app loads more data as the user scrolls down.
Courses
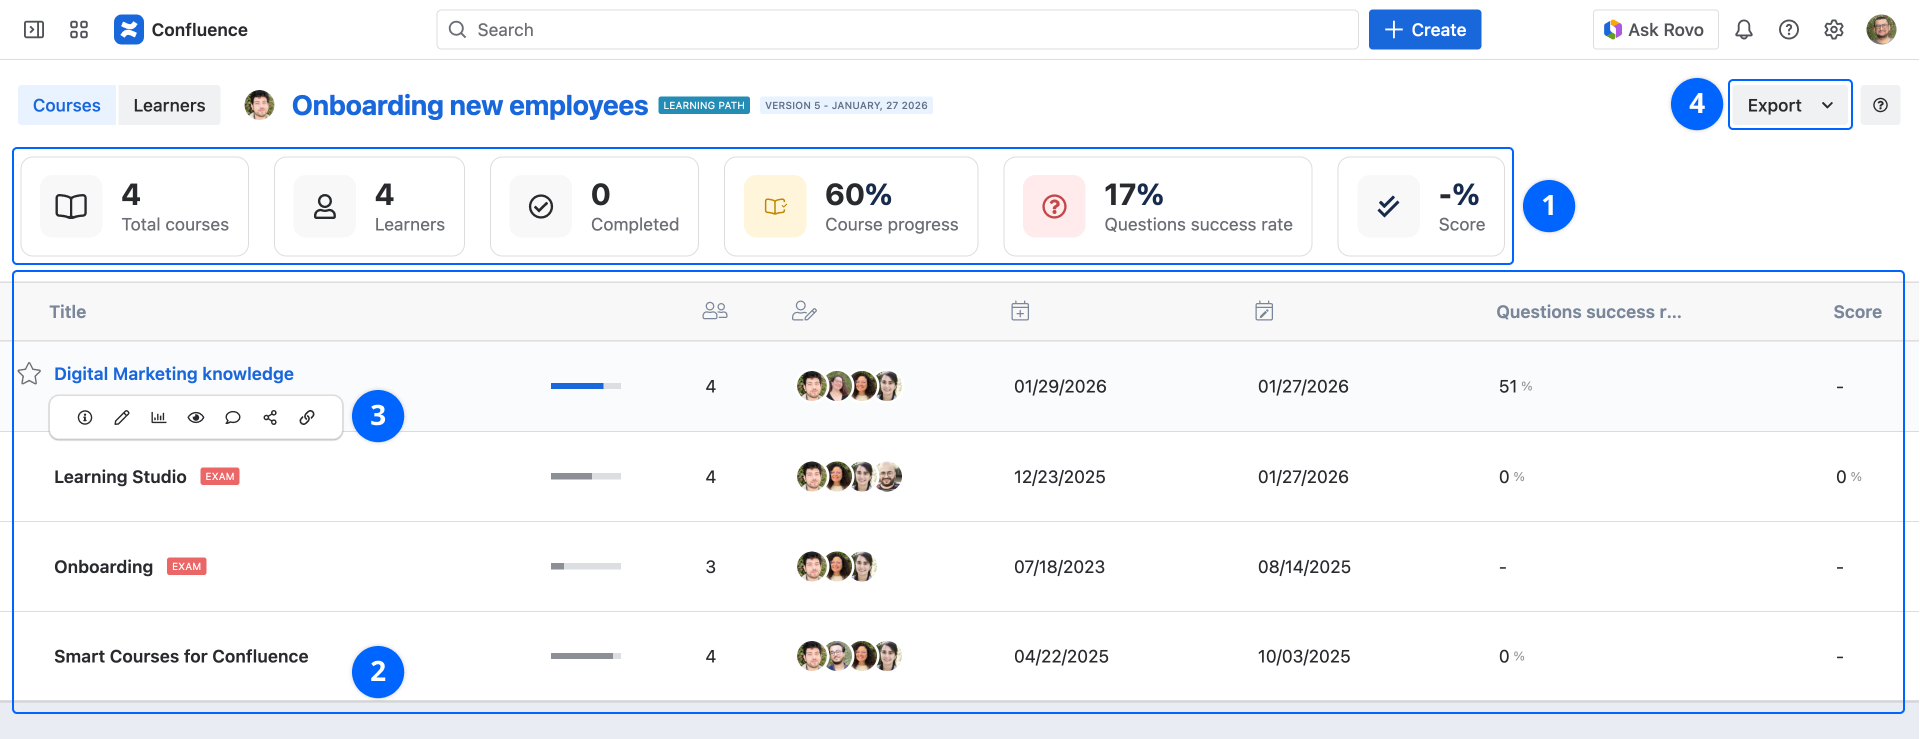
1. Average indicators
- Total courses: Listed courses count
- Learners: Learners count
- Completed: Number of learners who have completed the learning path
- Course progress: The average percentage of visited components for all courses
- Questions success rate: The average right answers rate for the answered questions
- Score: The average score of all learners
2. Insights grid
This grid lists the average course insights. Each row corresponds to a course:
- Title: Course title with a link to the detailed insights of this course. A special indication is displayed next to the title if the course is an Exam or a Draft
- Course progress: The average percentage of visited components
- Learners: Learners count
- Publishers: List of users who have contributed to the course
- Publication date: Last publication date
- Modification date: Last modification date
- Questions success rate: The average right answers rate for the answered questions
- Score: The average score of all learners
Average score is only available if the course is an exam.
3. Actions
- Course details: Displays additional content information
- Edit: Open course editor
- Course insights: Open course insights
- Preview: Open course preview
- Comments: Browser or add course comments
- Share: Select a user or a group of users to invite them to attend the course
- Copy course link: Copy course player link
Click on the course title to open the course insights.
4. Export insights
Select the XLSX or CSV format to export all the data from the grid.
Learners
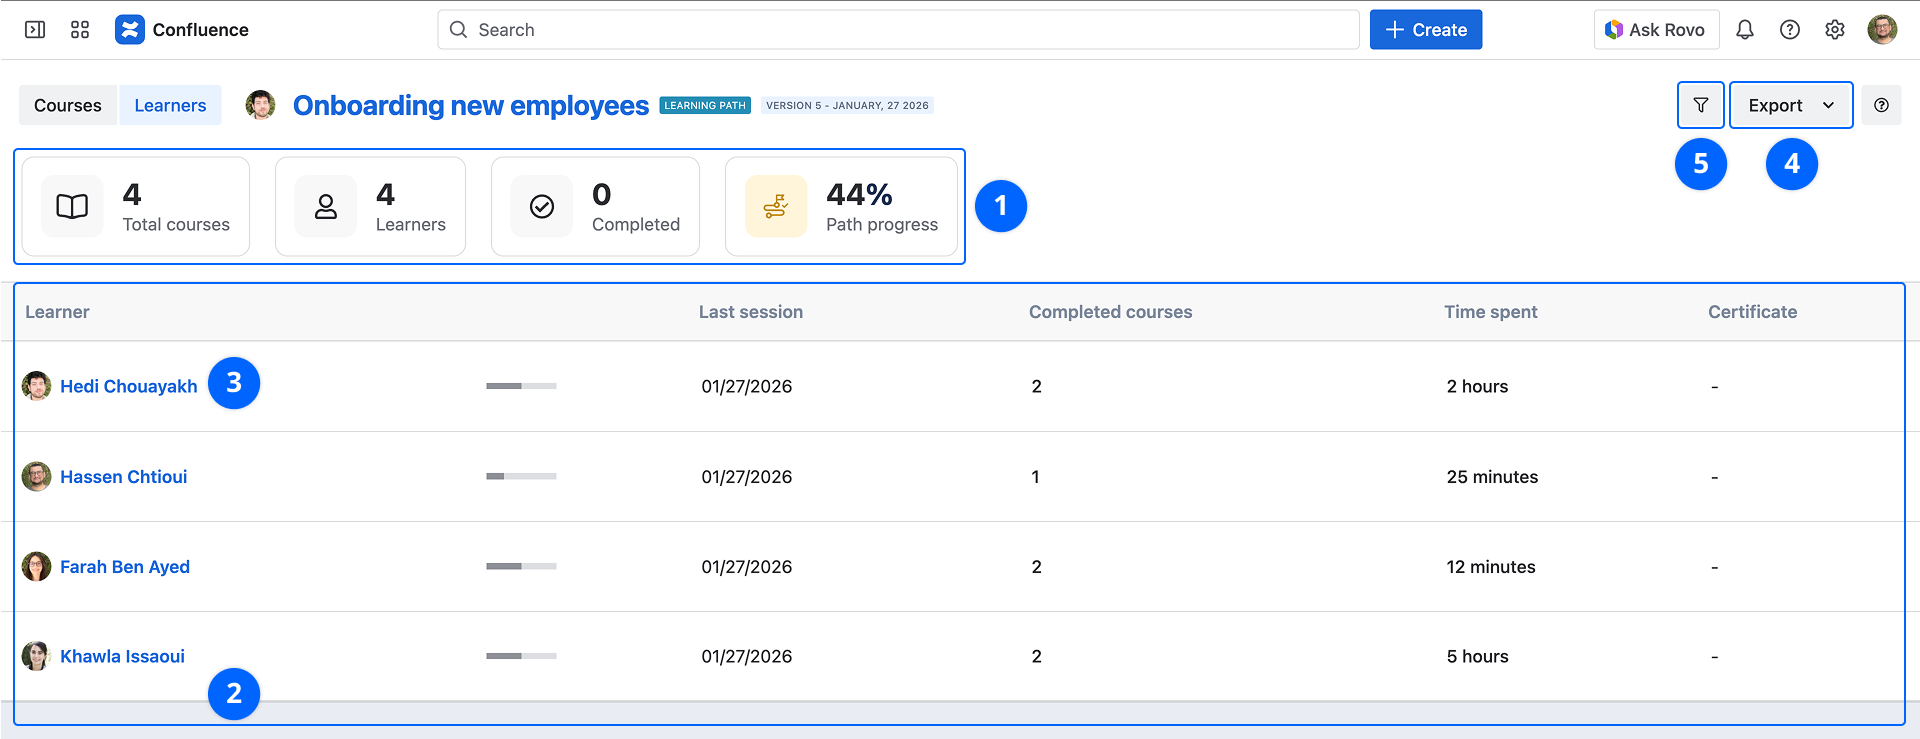
1. Average indicators
- Total courses: Listed courses count
- Learners: Learners count
- Completed: Number of learners who have completed the learning path
- Path progress: The average percentage of completed courses
2. insights grid
The insights grid lists the following details:
- Learner: Learner's full name and a link to the profile
- Path progress: The percentage of completed courses
- Completion date: Date of path completion
- Last session: Date of the last attended session
- Completed courses: Number of completed courses
- Time spent: Learner's session duration
- Certificate: Generate the learner's certificate
3. Actions
- Delete session: Reset the user session
- Course: Open the user dashboard
4. Filtering
- Search user: This allows you to filter insights per user
Search group: This allows you to filter insights per group
5. Export insights
Select the XLSX or CSV format to export all the data from the grid.